Part 2 here is for long-time Python programmers in class CP-3
This should be a very interesting project:
* We should get results that let us predict how often the temperatures in Las Cruces (really, in a place nearby, the Jornada Range Headquarters) reach or exceed any temperature we ask about.
* We can even predict how many days pass, on average, between repetitions of this extreme temperature. The results can be used to help people prepare for very high temperatures.
* We can even predict the average number of days before we hit a temperature that’s even higher than any one yet recorded!
* We can look at older data and see if the probability of very high temperatures has increased, possibly from global climate change.
* We can do the same for extreme low temperatures.
We will use a special method in the discipline of statistics. The method is presented in a book, Chance in Biology, written by Stephen Gaines and Mark Denny. I’ve prepared all the math so that you and I can do the Python programming to use the math.
22 January 2022: recounting recent progress and the plans going forward:
* We implemented code that lets us read data from an external file, particularly in the format called csv, for “comma-separated values.”
When you run the program, it asks you to browse for the file.
You had to get the file from one of my Google Drive folders shared with all of you.
The code nicely avoids tedious reloading of the file on every run of the code.
* There are special data (“are” is used because “data” is plural, the plural of “datum,” a “given”) we want to work with. The data are the record of the daily high and low temperatures for 10 years (or more). The values were recorded at the headquarters of the Jornada Range, north of town.
* First, we’ll consider the daily high temperatures. They’re all in degrees Fahrenheit, by the way. We can convert them to Celsius later, for true scientific use. The values range from 29 to 105. We want to see if we can predict how often the high temperature reaches any magnitude we choose, say, 100. This can be used to predict how often a temperature of 100 or more occurs – that is, say,, on average 5 times a year.
* To do this, we figure out the “statistical distribution” of high temperatures; call these Thi. This is the frequency, such as percentage, of days on which Thi reaches or exceeds any value we choose. It might look like this (using all actual data for the Jornada Range headquarters):
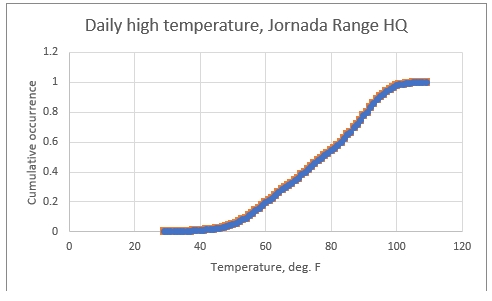
You see that the likelihood of a given daily high temperature rises slowly at low value, then gains pretty regularly, and suddenly tapers off in gaining at very high values. We want to look at that high end, even to see what might lie even beyond it.
* Actually, we have to sample the temperatures a special way. We divide the 10 years of data (actually, only 3424 days that have good data) into separate intervals of, say, 30 days. That gives us 114 intervals, all of the same length. In each one we find the highest temperature and save it. We can do this in a Python program!
* We then sort the max temperatures from lowest to highest. This is more of the Python program above.
* We then use an online program that “fits” the pattern to a standard mathematical form, called a Gumbel distribution. It gives us three numbers that capture the pattern in the distribution. We’ll talk about what statistical distributions are. The mathematical form involves a function called the exponential. We’ll talk about the meaning of a “function” and the meaning of an exponential.
* Finally, we use the mathematical form to predict the average return time, the time between recurrences of any chosen temperature at or beyond a value we choose.